HomeScientific activitiesMain Results of 2010 - 2017 years

Main Results

Main Results of 2017

  • Print
  • E-mail

Major Results of 2017

Result №1


The new breadboard model of electrical survey equipment with noise-like signals (ЭРК ШПС) notable for advanced technical features and parameters was developed and constructed (fig.1). Laboratory measurements of signal-noise ratio As/An for two breadboard ЭРК ШПС models showed that the signal-noise ratio measured for the new ЭРК ШПС model increased by 22 dB (12.6 times) in comparison with the model constructed earlier.

The ЭРК ШПС measuring complex is planned to be used in electromagnetic monitoring of stressed and deformed state of the Earth’s crust at measuring sites of Bishkek geodynamic proving ground.


Figure 1 – External view of the measuring channel of the new ЭРК ШПС breadboard model:

1 – induction signal transmitter; 2 – power supply of the induction signal transmitter; 3 – calibration signal shaper; 4 - signal filtering unit; 5 – unit of signal control and record ; 6 – power supply of the unit of signal control and record

Authors:

Pavel Ilyichev, Vladimir Bobrovsky, Maksim Lisimov


Publications:

1.             Ильичев П.В. Оптимизация технических параметров и характеристик геоэлектроразведочного измерительного комплекса с шумоподобными сигналами // Проблемы геодинамики и геоэкологии внутриконтинентальных орогенов: Тезисы докладов VII Международного симпозиума, г. Бишкек, 19-24 июня 2017 г. – Бишкек: НС РАН, 2017. – с. 409-412.

2.             Лашин О.А. Разработка блока управления и регистрации сигналов для геоэлектроразведочного измерительного комплекса с шумоподобными сигналами // Современные техника и технологии в научных исследованиях: Сборник материалов IX Международной конференции молодых ученых и студентов.– Бишкек: НС РАН, 2017. с. 84-92.


Result №2

Space-time relationship between local seismicity and variations of deformation state of the Earth’s crust was registered at the territory of Bishkek Geodynamic Proving Ground (Northern Tien Shan).

Results of linear-angular and GPS observations in comparison with seismicity and source mechanisms made it possible to estimate geodynamic environment during local earthquake of 10 energy class. Several days before the earthquake, GPS data showed the lowering of the earth surface with amplitude up to 20 mm in this area. 5 days before and 2 days after the event, optical range measurements showed the increasing of lengths of lines crossing the Shamsi Fault on average by 8 mm within ~2 km from the earthquake source. Such increasing of fault width corresponds to variations of tectonic stresses ~7MPa near the fault.

Figure. Layout of researched area showing the location of grounds (sites and their numbers) of linear-angular observations POLIGON, KENTOR and ALMALY (1), GPS sites IATA, IAT3, POL2, CHUM (2), transient electromagnetics stations (3) and seismic focus (4)  - focal mechanism. Lines – active faults.


Authors:

Sergey Kuzikov, Vitaly Bragin, Nelya Sycheva

Publications:

Соболев Г.А., Кузиков С.И., Брагин В.Д., Сычева Н.А. Изменение деформаций на территории геодинамического полигона на Тянь-Шане и местное землетрясение 12.02.2013 г. // Геофизические исследования. 2017. Т.18. №3. С.45-59.


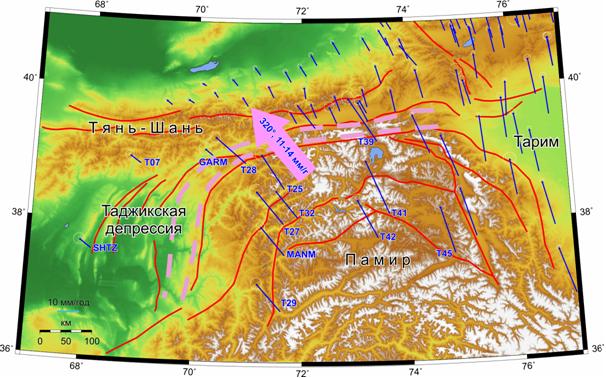
1. We have determined the structure of modern movements of the Earth’s crust at the territory of Pamir and its closest northwestern surroundings according to GPS observations data.


According to GPS observations data, for the first time it was shown that the massif of Pamir is not a monolithic block and that between its outer GPS points there are differences in horizontal velocity vectors by 3-10 mm/year.  The eastern boundary of Pamir Mountains and Tarim Depression is feebly marked kinematically with a slight lagging of Tarim from Pamir up to 2-4 mm/year, with their common movement to the north and moving of Tarim’s northern part away from Pamir to the east. Maximal crustal shortenings in this region are situated in the arc-shaped zone of the northwestern framings of Pamir 35-60 km wide, and the Pamir massif moves north-westward (~ 320°) with 11-14 mm/year velocity relative to the territory of Tajik Depression and Western Tien Shan.


Horizontal velocity vectors for 13 new GPS sites of Tajikistan and adjacent territories for 2007-2011 in EURA 2005 reference system. Red lines – basic active faults. Purple dotted line – zone of maximal deformations. Purple arrow – direction and velocity of modern movements of Pamir massif relative to Tien Shan and Tajik Depression.


(The work was headed by Vladimir A. Zeigarnik, Doctor of Engineering, RS RAS, tel. 996-312-613140)


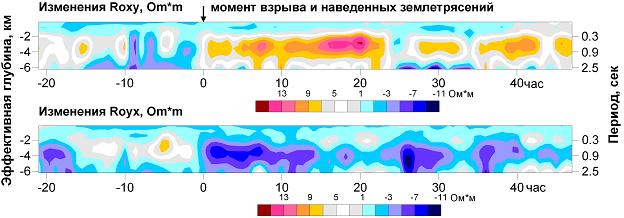
 2. We have received a stable response of variations of apparent resistance to the changes of stressed-deformed state of medium in the interval of effective depths from 1.5 km to 5 km triggered by a large industrial explosion. To explain the recorded variations we suggested a hypothesis about redistribution of fluid in the system of related cracks during deformation of rock massif.


Time series of variations of apparent resistance presented in the form of pseudosections in the directions of xy and yx (0º and 90º)


According to the data of seismological observations, the Kambarata industrial explosion has triggered two small earthquakes at a distance ~15 km which changed the stressed-deformed state of medium and caused changes in electrical properties of medium. The results of processing of magnetotelluric monitoring data indicated significant variations of apparent resistance of the opposite sign on the orthogonal azimuths of observations. Such behavior of variations proves the hypothesis about redistribution of fluid in the system of related cracks during deformation of rock massif.  

(The work was headed by Anatoly K. Rybin, Candidate of Science in Physics and Mathematics, RS RAS, tel. 996-312 - 613140)


3.  We have revealed the effect of microseisms generation during electric sounding sessions using a powerful electropulse system ERGU 600-2.


We have ascertained that during the sessions of electric sounding of the Earth’s crust by powerful current pulses (600 A) on a large area around the electric dipole (30×30 km), there appears a series of microseisms which causes a discharge of the stressed state of the Earth’s crust.  Generation of microseisms occurs both during the sounding session and after the session. 

Generation of microseisms was caused by the forced seismic vibrations in the medium which occur during electric sounding.  The optimal matched filtering of seismic signal made it possible to distinguish the response in seismic field from the pulse current sequence generated by ERGU 600-2 in electric dipole. 

(The work was headed by Vitaly D. Bragin, Candidate of Science in Physics and Mathematics, RS RAS, tel. 996-312-613140)

Major Results of 2017


Result №1


The new breadboard model of electrical survey equipment with noise-like signals (ЭРК ШПС) notable for advanced technical features and parameters was developed and constructed (fig.1). Laboratory measurements of signal-noise ratio As/An for two breadboard ЭРК ШПС models showed that the signal-noise ratio measured for the new ЭРК ШПС model increased by 22 dB (12.6 times) in comparison with the model constructed earlier.

The ЭРК ШПС measuring complex is planned to be used in electromagnetic monitoring of stressed and deformed state of the Earth’s crust at measuring sites of Bishkek geodynamic proving ground.

Figure 1 – External view of the measuring channel of the new ЭРК ШПС breadboard model:

1 – induction signal transmitter; 2 – power supply of the induction signal transmitter; 3 – calibration signal shaper; 4 - signal filtering unit; 5 – unit of signal control and record ; 6 – power supply of the unit of signal control and record


Authors:

Pavel Ilyichev, Vladimir Bobrovsky, Maksim Lisimov


Publications:

1.             Ильичев П.В. Оптимизация технических параметров и характеристик геоэлектроразведочного измерительного комплекса с шумоподобными сигналами // Проблемы геодинамики и геоэкологии внутриконтинентальных орогенов: Тезисы докладов VII Международного симпозиума, г. Бишкек, 19-24 июня 2017 г. – Бишкек: НС РАН, 2017. – с. 409-412.

2.             Лашин О.А. Разработка блока управления и регистрации сигналов для геоэлектроразведочного измерительного комплекса с шумоподобными сигналами // Современные техника и технологии в научных исследованиях: Сборник материалов IX Международной конференции молодых ученых и студентов.– Бишкек: НС РАН, 2017. с. 84-92.


Result №2

Space-time relationship between local seismicity and variations of deformation state of the Earth’s crust was registered at the territory of Bishkek Geodynamic Proving Ground (Northern Tien Shan).

Results of linear-angular and GPS observations in comparison with seismicity and source mechanisms made it possible to estimate geodynamic environment during local earthquake of 10 energy class. Several days before the earthquake, GPS data showed the lowering of the earth surface with amplitude up to 20 mm in this area. 5 days before and 2 days after the event, optical range measurements showed the increasing of lengths of lines crossing the Shamsi Fault on average by 8 mm within ~2 km from the earthquake source. Such increasing of fault width corresponds to variations of tectonic stresses ~7MPa near the fault.


Main Results of 2010

  • Print
  • E-mail

1. According to the data of magnetotelluric soundings and laboratory studies of physical properties of low crust and upper mantle xenoliths of the Southern Tien Shan, the position of Moho surface has been reconstructed to early Paleogene. 

The results of interpretation of magnetotelluric soundings, laboratory measurements of electroconductivity under high temperatures and pressure, measurements of elastic waves’ velocities and thermobarometry of low crust and upper mantle xenoliths have shown that the depth of occurrence of Moho boundary in the southern part of the Tien Shan has increased from 35 to 55 km during 70 million years. The value of heat flow at the surface during the same period of time has decreased from 80 mW/m2 to 60 mW/m2 indicating the cooling of the region’s lithosphere during this period of time.


2. We have received the explosion time-travel curves plotted on first arrivals of P and S waves at a distance of up to 230 km from a powerful industrial explosion (2.8 kT) near Toktogul Reservoir on the 22nd of December, 2009. 

As a result of seismic studies came the explosion time-travel curves plotted on first arrivals of P and S waves at a distance of up to 230 km which are of great deficit in the world. The previous travel-time curve received as far back as in 1975 on the base of industrial explosion during creation of a power dam of Toktogul hydrostation contained considerable inaccuracies due to application of analogue equipment, synchronization by signals of broadcasting stations, operator reactions.  The travel-time curves received by using new digital seismic stations make it possible to calculate parameters of seismic events more accurately and can be used for studies of deep structure of the Earth’s crust. 


3. As a result of unipolar electromagnetic impacts in 2000-2005 for seismotectonic deformations, we have revealed that directions of contraction axes and the shearing mode have changed to a transpression for the western part of Bishkek proving ground.   

To study the influence of unipolar energy impacts (EI) on the mode of seismotectonic deformations (STD) we used the catalogue of focal mechanisms which contains the parameters of seismic focuses with К ≥ 6 within the KNET territory. We have formed 2 sampling groups of seismic events: the events occurred within 17 days before and after the EI. For the events occurred before the EI day for the western part of the investigated territory we have revealed the shearing nature of STD, and the transpression mode was revealed for the eastern part. And for the sampling group after the EI day, the shearing mode changes to tranpression mode in the western part of the proving ground. And here we note the changes in distribution of azimuths of contraction axes. Such changes in the state of geomedium can be caused by EI.


 4. We have determined the changes in intensity of geoacoustic emission (GAE) during operation of electrical prospecting generating plant (ERGU) for borehole observations around Bishkek geodynamic proving ground.  

The increase of GAE intensity (borehole № 1156, Gornaya Maevka) was recorded at all the measuring channels of geoacoustic equipment during operation of ERGU during measurements in August and September of 2010. The spectral analysis has shown that in some cases the dominant frequencies which had been unnoticeable before appear in spectrum immediately with the beginning of ERGU session while the old frequencies are preserved (among the new frequencies the ones higher than 200 Hz prevail). We can also observe the responses which appear in the broad frequency spectrum but with a clear dominance of frequencies higher than 200 Hz. There are some differences between spectra for different sensor components (intensity of new frequencies and time of their appearance from the beginning of ERGU session), however, frequency maximums are the same.


Photogallery

Geographic location

40 km. from Bishkek