2019 year
Brief formulation: Electromagnetic sounding of the earth's crust at the Bishkek geodynamic test site (Northern Tien Shan) is accompanied by continuous stress relaxation, which is reflected in the accumulation of Benioff's conditional deformations.
Text with description: Interpretation of data on the relationship between electromagnetic soundings and variations in seismicity of the Northern Tien Shan for the entire period of soundings, starting from 1983, has been carried out. The previously noted cases of an increase in Benioff deformations in excess of the linear trend in 1987 - 1989 and 2002-2005 were proposed to be interpreted as the cumulative result of continuous soundings in modes with the highest energy contribution, started in 1983 and 2000, respectively.
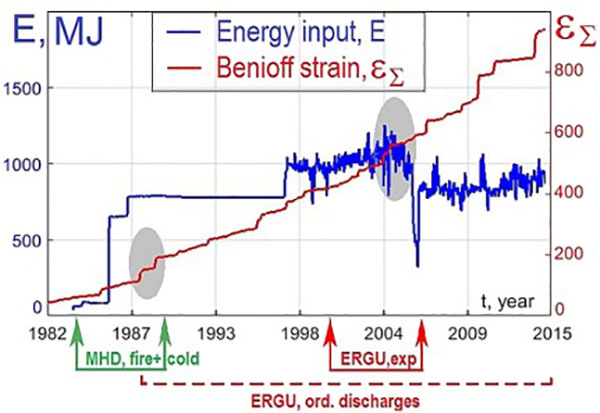
Image of the result
Timeline of the energy contribution during the period of electromagnetic soundings and Benioff deformation (conventionally defined for each event as the root of seismic energy, expressed in J), in 1980 - 2016. The energy input graph shows the daily electrical energy of soundings: before 1996 - the average passport value, and after 1996 - the measured value. During the combined impacts (MGD generator starts and cold starts), as well as during the third stage of experimental soundings (highlighted in the graph), the tilt angle increased. This may mean that stress relaxation has increased in the area near the feeding dipole, and the increase in deformations is associated with earthquakes of moderate strength.
(In collaboration with the Institute of Marine Geology and Geophysics FEB RAS)
Sychev V.N., Bogomolov L.M., Sycheva N.A. Electromagnetic soundings of the earth crust and deformation processes in geosphere of the Bishkek geodynamic polygon (BGP) // IOP Conf. Ser.: Earth Environ. Sci. 2019. Vol. 324. 012008
Brief formulation: There was a significant increase in long-range correlations in the region under consideration immediately before the main event and the preservation of increased correlations in the aftershock sequences.
Description text: The value of the Tsallis parameter q> 1 indicates that the earthquake catalog is a nonequilibrium system with memory and long-range correlations. Variations of the parameter in individual samples with respect to the value calculated over the entire catalog show the change in long-range correlations.
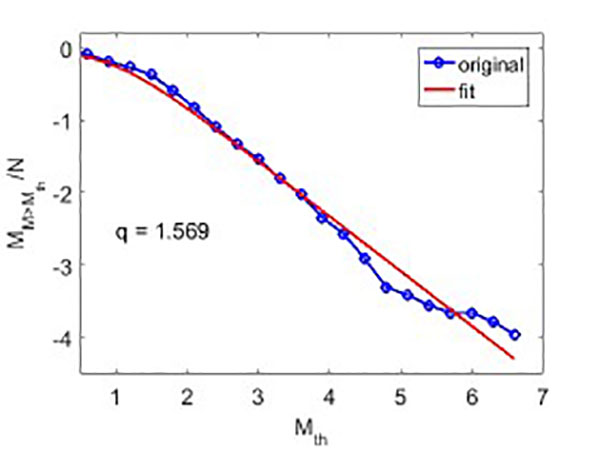
Distribution of the relative number of earthquakes with magnitude M> Mth and the values of the parameter q constructed from the 1980-2017 earthquake catalog
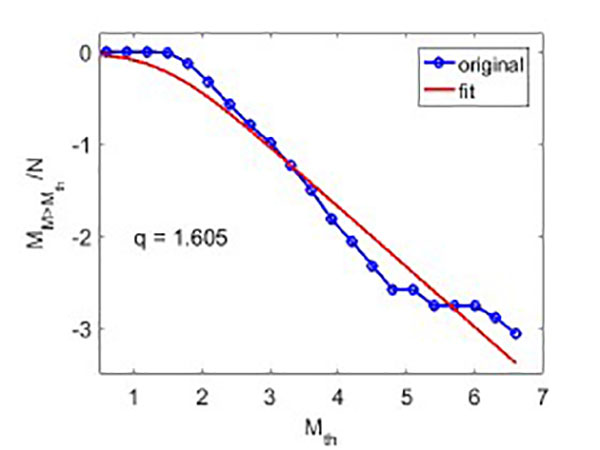
Distribution of the relative number of earthquakes with magnitude M> Mth and the values of the parameter q constructed from aftershocks of the 1992 Suusamyr earthquakes
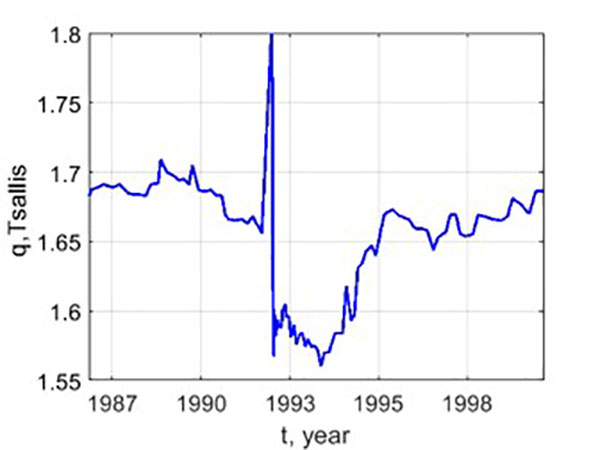
Behavior of the Tsallis parameter in dynamics in the period near the date of the Suusamyr earthquake
The Tsallis parameter q, calculated for the entire catalog, has a value of q = 1.525, which agrees with the values obtained for other seismically active regions. The Tsallis parameter calculated for aftershock sequences varies from 1.518 to 1.674 and exceeds the value obtained for the entire catalog, which indicates that long-range correlations increase in the observed system before the main event, which persist during aftershock activity.
Sychev V. N. and Sycheva N. A. The earthquakes aftershock processes of the Tien Shan and its surrounding area // IOP Conf. Series: Earth and Environmental Science 324(2019) 012003 doi:10.1088/1755-1315/324/1/012003.
It was proposed to use the DBSCAN (Density-Based Spatial Clustering of Applications with Noise) algorithm to extract useful acoustic emission signals during uniaxial compression of geomaterial samples.
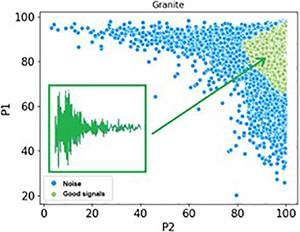
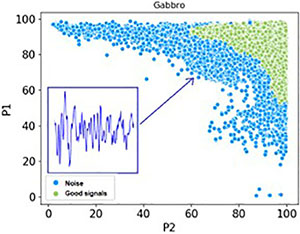
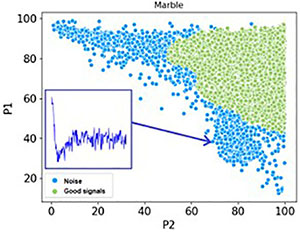
Isolation of useful signals by the method of cluster analysis DBSCAN for samples of granite, gabbro and marble (useful signals are highlighted in green, noise is highlighted in blue)
2018 year
Time series of normalized electrical resistance R / R0 of gabbro samples demonstrate the presence of multifractal behavior (Figure 1). Variations in the Hurst parameter of the time series data, calculated using the DFA method in a sliding window (Figure 2), showed the presence of a characteristic minimum, which occurs at the moments of time when the samples were subjected to loads of ~ 54-58% of the ultimate strength. Good agreement with the data of normalized electrical resistivity obtained for marble and granite samples (Figure 3) suggests that the area containing the characteristic minimum of variations in the Hurst parameter for gabbro samples can serve as an indicator of the moment of the transition of geomaterial from the hardening stage to the fracture stage. The indicated transition moment can also be used to set the sessions of irradiation of the sample with electric pulses in the tasks of studying the trigger effect, since at the stage of softening the electric action will be more effective than the action at the stage of hardening.

Figure 1 - Variations in the normalized electrical resistance R / R0 of a gabbro sample (Gb1) (a) and high-frequency noise after removing the low-frequency trend (b)
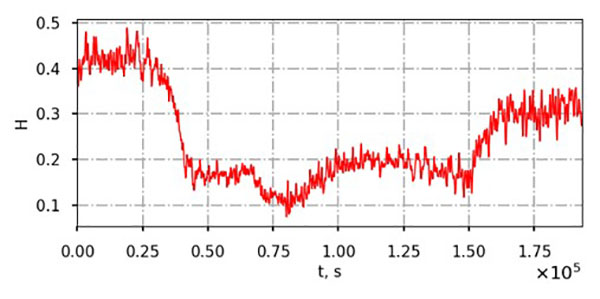
Figure 2 - Variations of the Hurst parameter of the normalized electrical resistance R / R0 of the gabbro sample (Gb1)
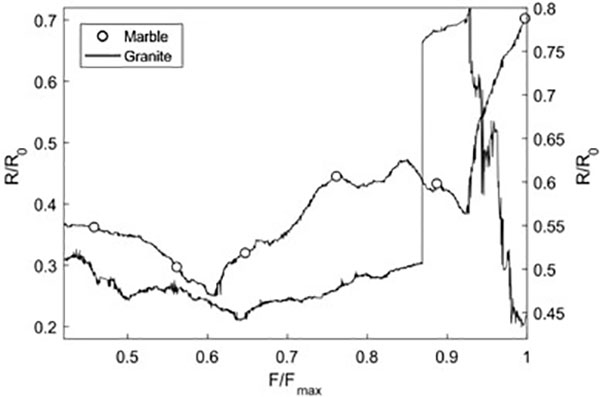
Figure 3 - Variations in the electrical resistance of marble and granite samples depending on the load level
1.Cheshev, M. E.; Sychev, V. N.; Imashev, S. A. Algorithm of optimal choice of time series ranges for fractal analysis // Geosystems of Transition Zones, 2018, vol. 2, N 2, p. 125–130. doi:10.30730/2541-8912.2018.2.2.125-130
2.Imashev S.Fractal Analysis of Electrical Resistance of Gabbro Samples During Uniaxial Compression // Herald of KRSU. 2018. vol. 18. no. 8. P. 160-164.
2017 year
The study of deformation of samples of marble from the Ak-Tash deposit, granite from the Kaindy deposit, Kyrgyzstan and gabbro was continued. Comparisons of the values of dielectric parameters with damageability (acoustic emission) and deformations of the sample are made.
At loads below 0.7 from fracture, the sample structure undergoes a compaction process; therefore, both the deformations and the AE activity have minimum values, while the electrical resistance of the samples decreases (similar to the case of granular media). With a further increase in the principal stress, as the accumulation of microdefects and the process of their consolidation into larger defects (at least in the initial stage), the electrical resistance of the samples also increases.
For relatively dry rock samples, the electrical resistance increases due to the opening of microcracks, which is confirmed by the correlation of variations in electrical resistance with deformations, the accumulation of defects in the sample, and the activity of acoustic emission. A distinct minimum of electrical resistance demonstrates the moment of transition of the material from the stage of hardening to the process of destruction. Electrical monitoring can be used for cost-effective monitoring of structural damage.
For samples of granite, marble and gabbro, the responses of the AE activity, deformation and its rate to electrical action at various load levels were obtained. This may indicate that when irradiated with electric pulses, energy is supplied to the local area, in which a partial discharge of excess voltages subsequently occurs. This manifests itself in the form of an increase in AE events, deformation and its rate.
The method of multifractal signal analysis - DFA (Detrended Fluctuation Analysis - analysis of fluctuations after excluding scale-dependent trends) is described. The method of analyzing fluctuations after excluding scale-dependent trends can be used to study low-energy seismic signals before, during and after the onset of seismic events. The proposed improvement of the trend removal method based on the discrete wavelet transform gives better results in comparison with the traditional polynomial detrending, and the improved algorithm increases the accuracy of estimating the boundaries of the singularity spectrum. On the example of a seismic signal, detrending and analysis of the dynamics of its multifractal characteristics were carried out.
The catalog of earthquakes is considered from the standpoint of nonequilibrium thermodynamics using Tsallis statistics. The calculated Tsallis parameter shows that the earthquake flow characterizes the system under consideration as non-additive with memory and long-range correlations.
The results of the study of seismic and seismoacoustic noise records using the method of structure functions proposed by A.N. Kolmogorov are presented. to study the statistical properties of turbulence in the inertial and dissipative ranges. Estimates of the scales of correlations based on earthquake records and geoacoustic noise data are obtained. The calculated values show that the regime soundings using the ERGU600-2 installation cause a change in the structures of the order of the first tens of meters.
2016 year
Work has been done to improve experiments aimed at studying the effect of physical fields on acoustic emission and the rate of destruction of loaded geomaterials.
• Developed and put into operation software for measuring deformation during the destruction of geomaterials using the LA-i24USB ADC.
• Created software for measuring the dielectric parameters of loaded samples of geomaterials, including the tangent of dielectric loss angle and figure of merit.
• Developed software for generator control Siglent SDG1005.
At the upper site of the NS RAS, a measuring point is equipped (an underground bunker where the receivers of seismoacoustic emission (SAE) and seismic noise signals are located) - a seismic station Reftek 130 DAS and a seismic receiver A1632 are installed, as well as data collection has been set up for the server of the laboratory of the MES NS RAS. A database of seismoacoustic emission (SAE) and seismic noise signals recorded on the territory of the Bishkek geodynamic test site has been created.
Significant variations in the dielectric loss tangent (tgδ) of marble, granite, and gabbro samples were found in the process of increasing the compressive load. For marble, the increase in tanδ at frequencies of the order of 100 Hz reaches a fivefold level. At high frequencies (10 and 100 kHz), the growth is less pronounced or absent. For gabbro and granite samples, on the contrary, the decrease in tgδ also reaches a fivefold level at frequencies of about 100 Hz. At high frequencies (10 and 100 kHz), the growth is less pronounced or absent.
