
Pre- and post-seismic anomalies in variations of the total electron content of the ionosphere above the epicenter of the Uchturfan earthquake (01/22/2024) were identified, indicating the relationship between lithospheric and ionospheric processes (2024).
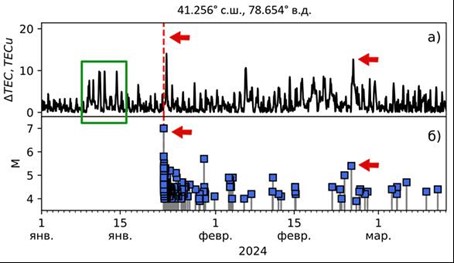
The analysis of geological and geophysical conditions and anomalous variations in the total electron content (TEC) in the Uchturfan earthquake (01/22/2024, 18:09 UTC) was carried out. The epicenter of the main shock is confined to the junction zone of the southern boundary of the Tien Shan Mountains and the Tarim Basin. The TEC analysis above the epicenter of the main event showed that against the background of diurnal periodicity with maxima in the interval of 05:00–09:00 UTC, an increase in values is observed after 01/09/2024 and the extreme value is reached after the main shock on 01/22/2024. The observed anomalous TEC values are not a consequence of magnetic storms. The areal distribution of TEC anomalies is localized in space and time, and is confined to the Maidan fault and the aftershock swarm zone.
|
Figure. Variations in TEC anomalies (ΔTEC) above the epicenter of the main event (a) and seismicity of the Uchturfan earthquake swarm M>4. The dotted line indicates the moment of the main event on 22.01.2024 (b). The rectangle is the area of anomalous TEC values associated with the processes of preparation of the seismic event. Arrows are TEC anomalies correlating with the main shock on 22.01.2024 (M=7) and a strong aftershock (M=5.4). |
An assessment of the mobility and deformations in tectonic blocks and fault zones in the territory of the Bishkek local GPS network (Northern Tien Shan) is given based on space geodetic observations for 1997–2021. (2024).
|
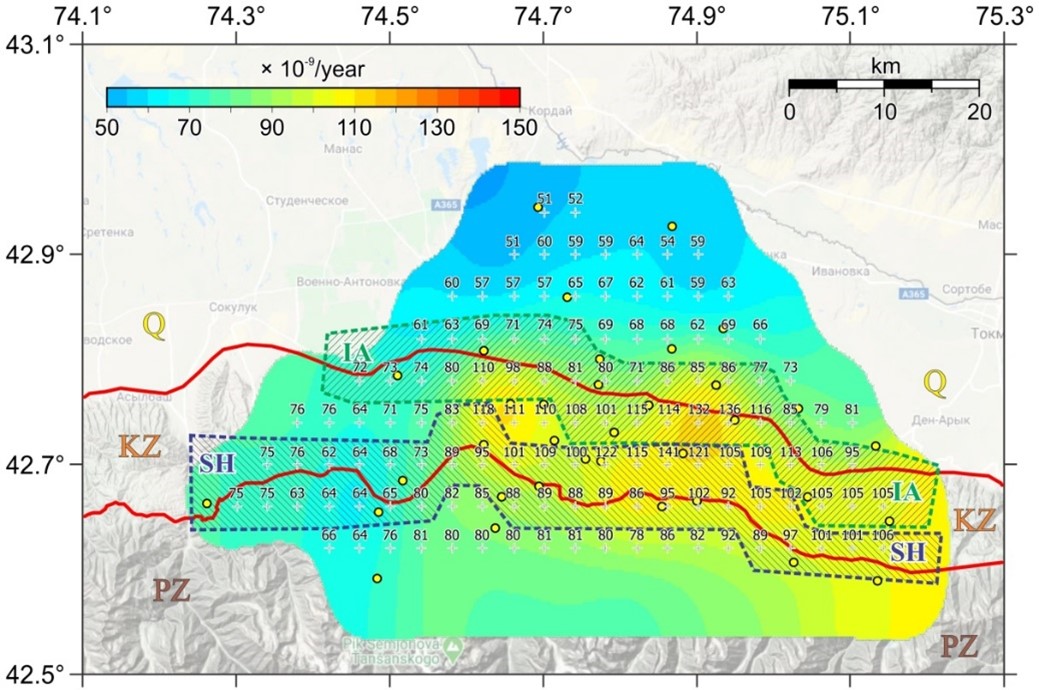
Figure. The second invariant of the horizontal strain rate tensor (linear and angular strains, 0.04° grid) based on the velocity vectors of the Bishkek local GPS network (yellow circles) for 1997–2021. IA is the Issyk-Ata fault line separating the Quaternary (Q) block and the Cenozoic (KZ) block. SH is the combined Shamsin fault line separating the KZ block and the Paleozoic (PZ) block. |
Based on the same GNSS measurement data at 10 stations in Central Asia, a comparison of 7 sets of average daily geocentric coordinates XYZ was carried out: 3 calculation methods in the GAMIT/GLOBK program, 2 methods in Bernese GNSS software and 2 Internet services. (2023)
|
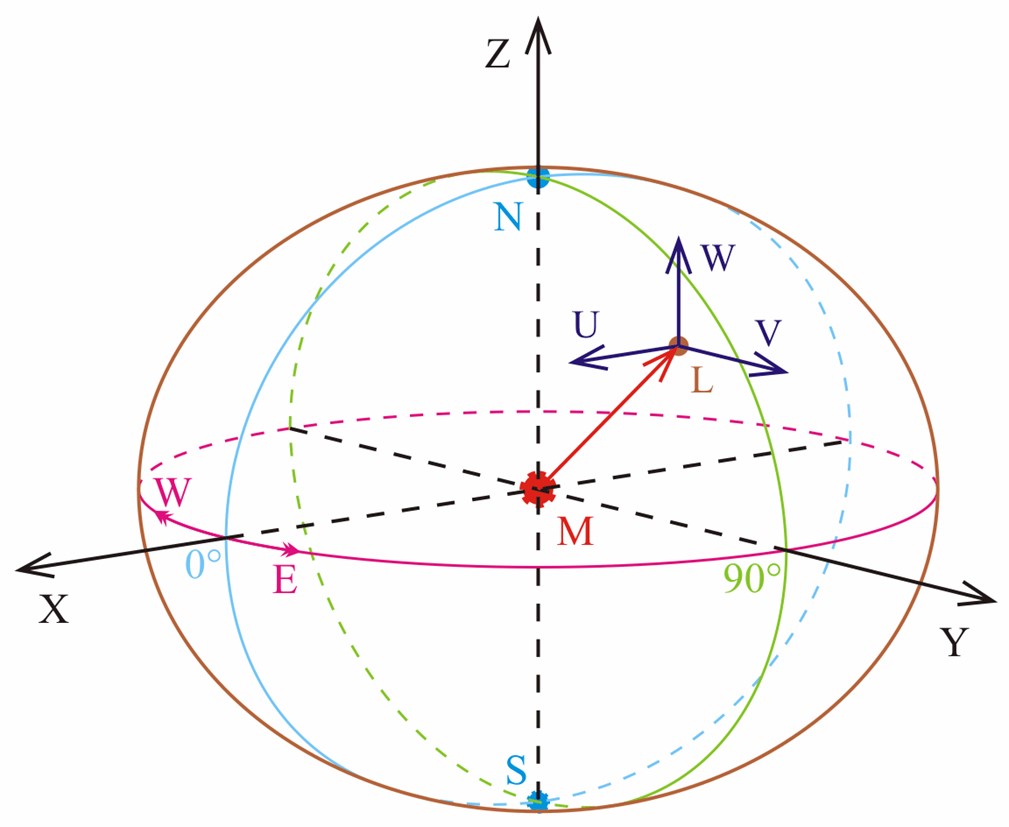
Figure. Position of the XYZ (geocentric Cartesian) and UVW (local) coordinate systems relative to the Earth's ellipsoid; X||U, Y||V, Z||W. Point M is the Earth's center of mass and the origin of the XYZ coordinates. Points N and S are the Earth's north and south poles on the Z axis. The X and Y axes pass through M and the intersections of the equator with the prime and 90° meridians. Arrows W and E denote the west and east directions along the equator. Point L is the average position of 10 GNSS stations for each day, aligned with the origin of the UVW coordinates. |
For high-precision linear-angular measurements, a Digital Portable Geodetic Meteorological Complex (DPGM) was created for rapid determination of meteorological parameters simultaneously at several points, for wireless transmission and averaging of data. (2022)
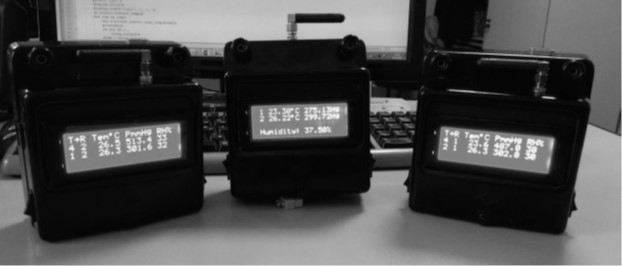
This compact device pertains to meteorology and geodesy, eliminates the cumbersome traditional set of geodetic meteorological instruments and the need to transmit meteorological information via a voice radio channel from one observation point to another. Several samples of the DPGM have been manufactured for the prompt comprehensive assessment of atmospheric parameters during regime linear-angular measurements at geodetic sites. Each device consists of digital sensors, a receiver-transmitter, a controller and a display. The meteorological stations are capable of automatically contacting each other via radio at distances of up to several kilometers and averaging the measured meteorological parameters for each individual pair of devices.
|
Figure. Example of joint operation of three digital geodetic weather stations exchanging information with each other. Continuous battery life of at least 6 hours without recharging. |
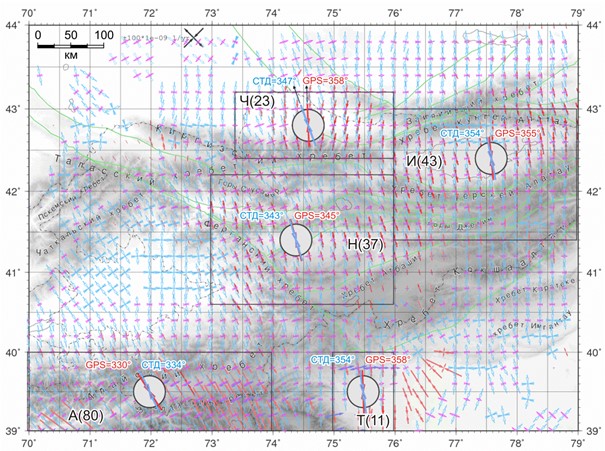
For the territory of Tien-Shan the general agreed directions of the main axes of horizontal deformation and their regional differences based on GPS and seismotectonic deformation (STD) methods to a depth of 25 km for 1997-2019 are estimated. (2021).
Using 0.2°≈18.5 km interpolation grid (39-44°N, 70-79°E) 5 regions with representativeness of 11-80 comparison pairs of GPS and STD methods data per region were identified. Most of the deformation for both methods is presented by shortening, which, on average, in all comparison data in the near-surface part of the Earth's crust (GPS) has an azimuth 343.1° and in the depth of 5-25 km (STD) – 342.8°. For individual regions, the average directions of the shortening axes of the 2 methods vary in the range of azimuths of 330-358°. The maximal divergence between the average directions of the shortening axes for GPS and STD methods is 11° in the area of the Chuy depression; in other regions the deviations of the axes do not exceed 4°.
|
Figure. STD for the depth of 5-25 km (blue arrows - axis of shortening, purple - extension) and the rate of modern horizontal near-surface deformation of the Earth's crust according to GPS data (red - shortening, blue - extension). Rectangular regions (number of STD and GPS data pairs): Ch - Chui, I - Issyk-Kul, N - Naryn, A - Alai and T - Tarim. The arrows in circles and degrees are the average rooting directions for the regions by STD and GPS methods. |